
Mathematics, 01.01.2020 04:31 tragesserj
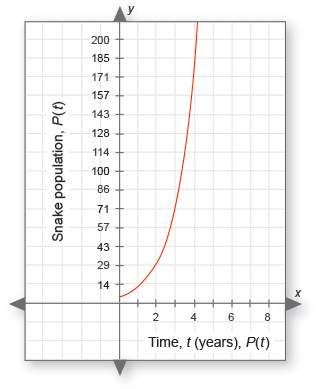
Below is the graph of the boa constrictor population. the x-axis is t, the time in years, and the y-axis is p(t), the snake population for any given year. in this case, t = 0 indicates the year they started keeping track of the boa population. scientists want to know how the snake population is changing every two years so they can make predictions about the next two years.
students' conjectures:
two students, sarah and ernest, agree that the graph is exponential but disagree on how the rate changes between successive time periods.
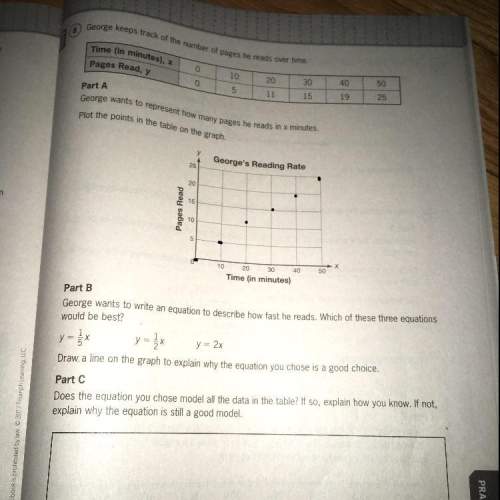
1. complete the table below to summarize each classmate's conjecture. (2 points: 1 point for each row of the chart)
classmate conjecture
ernest
sarah
2. using your knowledge of exponential functions, who do you think is correct? (1 point)
analyzing the data:
3. is this graph increasing or decreasing? does this imply that the boa constrictor population is growing or diminishing? (1 point)
4. looking at this graph, would you agree that the boa constrictor population could be a problem? (1 point)
5. what is the horizontal asymptote of this graph? (1 point)
6. what is the range? explain. (1 point)
7. what is the y-intercept? what does this mean in terms of the snake population? (1 point)
here is the function for this graph, where t is the time in years: p(t) = 5e0.89t.
8. use this formula to estimate the boa constrictor population in 2 years, 4 years, and 6 years. (6 points: 2 points for each year, including 1 point for showing your work and 1 point for the answer)
t: time in years p(t): estimated snake population at time t
2
4
6
9. find the rate of change for the snake population from year 0 to year 2. (2 points)
10. apply the rate of change you found in question 9 in order to estimate the snake population for year 4. how does your answer compare with the calculated value? (1 point)
11. if there are approximately 36,660 snakes (rounded to the nearest 10) in year 10, how many will there be in year 12? (1 point)
making a decision:
12. given your calculations above, is ernest's or sarah's conjecture correct? (2 points)

Answers: 3
Another question on Mathematics
Mathematics, 21.06.2019 19:00
Solve the equation using the zero-product property. -3n(7n - 5) = 0 a. 0, -5/7 b. -1/3, -5/7 c. -1/3, 5/7 d. 0, 5/7
Answers: 2
Mathematics, 21.06.2019 20:00
Someone answer asap for ! a discount store’s prices are 25% lower than department store prices. the function c(x) = 0.75x can be used to determine the cost c, in dollars, of an item, where x is the department store price, in dollars. if the item has not sold in one month, the discount store takes an additional 20% off the discounted price and an additional $5 off the total purchase. the function d(y) = 0.80y - 5 can be used to find d, the cost, in dollars, of an item that has not been sold for a month, where y is the discount store price, in dollars. create a function d(c(x)) that represents the final price of an item when a costumer buys an item that has been in the discount store for a month. d(c(x)) =
Answers: 1
Mathematics, 21.06.2019 21:30
Awater truck is filling a swimming pool. the equation that represents this relationship is y=19.75x where y is the number of gallons of water in the pool and x is the number of minutes the truck has been filling the pool.
Answers: 1
You know the right answer?
Below is the graph of the boa constrictor population. the x-axis is t, the time in years, and the y-...
Questions

Chemistry, 08.10.2019 15:00
Mathematics, 08.10.2019 15:00


Mathematics, 08.10.2019 15:00

Arts, 08.10.2019 15:00

Chemistry, 08.10.2019 15:00
History, 08.10.2019 15:00

Mathematics, 08.10.2019 15:00


