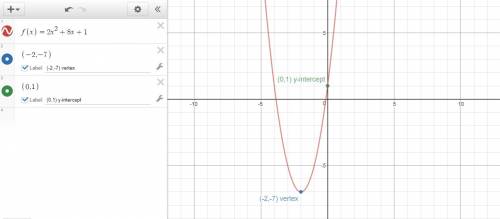
1. First we are going to find the vertex of the quadratic function
. To do it, we are going to use the vertex formula. For a quadratic function of the form
, its vertex

is given by the formula

;

.
We can infer from our problem that

and

, sol lets replace the values in our formula:


Now, to find

, we are going to evaluate the function at

. In other words, we are going to replace

with -2 in the function:


So, our first point, the vertex
of the parabola, is the point

.
To find our second point, we are going to find the y-intercept of the parabola. To do it we are going to evaluate the function at zero; in other words, we are going to replace
with 0:

So, our second point, the y-intercept of the parabola, is the point (0,1)
We can conclude that using the vertex (-2,-7) and a second point we can graph
as shown in picture 1.
2. The vertex form of a quadratic function is given by the formula:
where
is the vertex of the parabola.
We know from our previous point how to find the vertex of a parabola.
and
, so lets find the vertex of the parabola
.


Now we can use our formula to convert the quadratic function to vertex form:
We can conclude that the vertex form of the quadratic function is
.
3. Remember that the x-intercepts of a quadratic function are the zeros of the function. To find the zeros of a quadratic function, we just need to set the function equal to zero (replace

with zero) and solve for
.
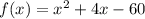
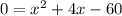
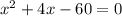
To solve for
, we need to factor our quadratic first. To do it, we are going to find two numbers that not only add up to be equal 4 but also multiply to be equal -60; those numbers are -6 and 10.
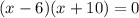
Now, to find the zeros, we just need to set each factor equal to zero and solve for
.

and


and

We can conclude that the x-intercepts of the quadratic function
are the points (0,6) and (0,-10).
4. To solve this, we are going to use function transformations and/or a graphic utility.
Function transformations.
- Translations:
We can move the graph of the function up or down by adding a constant

to the y-value. If

, the graph moves up; if

, the graph moves down.
- We can move the graph of the function left or right by adding a constant
to the x-value. If
, the graph moves left; if
, the graph moves right.
- Stretch and compression:
We can stretch or compress in the y-direction by multiplying the function by a constant
. If

, we compress the graph of the function in the y-direction; if

, we stretch the graph of the function in the y-direction.
We can stretch or compress in the x-direction by multiplying
by a constant
. If
, we compress the graph of the function in the x-direction; if
, we stretch the graph of the function in the x-direction.
a. The
value of
is 2; the
value of

is -3. Since
is added to the whole function (y-value), we have an up/down translation. To find the translation we are going to ask ourselves how much should we subtract to 2 to get -3?


Since
, we can conclude that the correct answer is: It is translated down 5 units.
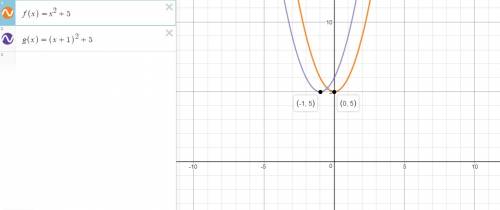
b. Using a graphing utility to plot both functions (picture 2), we realize that
is 1 unit to the left of
We can conclude that the correct answer is: It is translated left 1 unit.
c. Here we have that
is
multiplied by the constant term 2. Remember that We can stretch or compress in the y-direction (vertically) by multiplying the function by a constant
.
Since
, we can conclude that the correct answer is: It is stretched vertically by a factor of 2.