
Mathematics, 18.07.2019 00:30 shardaeheyward139
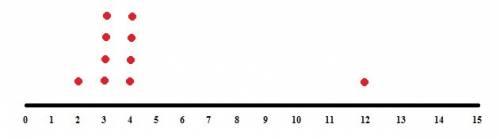
Agroup of 10 students participated in a quiz competition. their scores are shown below: 4, 4, 3, 4, 3, 12, 4, 3, 2, 3 part a: would a dot plot, a histogram, or a box plot best represent the data shown above if the purpose of the graph is to highlight the frequency of each individual score? explain your answer. (4 points) part b: provide a step-by-step description of how you would create the graph named in part a. (6 points)

Answers: 1
Another question on Mathematics
Mathematics, 21.06.2019 20:00
Landon wrote that 3−2.6=4. which statement about his answer is true?
Answers: 1
Mathematics, 21.06.2019 21:30
Your friend uses c=50p to find the total cost, c, for the people, p, entering a local amusement park is the cost of admission proportional to the amount of people entering the amusement park? explain.
Answers: 2
You know the right answer?
Agroup of 10 students participated in a quiz competition. their scores are shown below: 4, 4, 3, 4,...
Questions

Mathematics, 02.08.2021 01:00
Mathematics, 02.08.2021 01:00

Mathematics, 02.08.2021 01:00

Physics, 02.08.2021 01:00
Chemistry, 02.08.2021 01:00


