
History, 14.12.2021 20:40 leilei2003
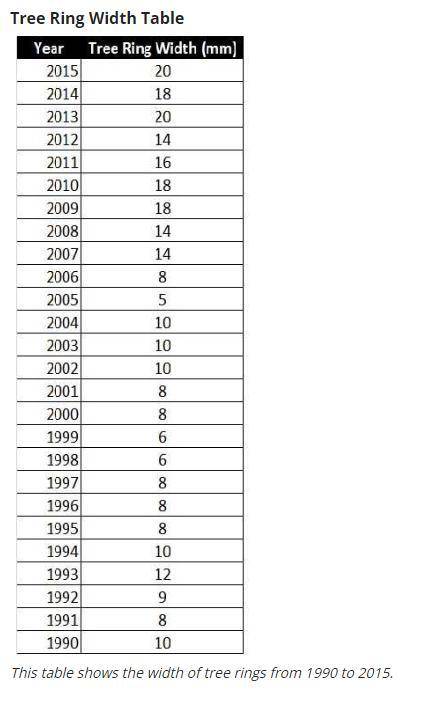
Use the data to create a line graph with “Year” along the x-axis and “Tree Ring Width (mm)” along the y-axis.
Using your graph, which year or years can you infer had the least amount of precipitation (rain)? Which year or years had the most amount of precipitation (rain)? Use evidence from your Tree Ring Width graph to explain your reasoning.
I think that _ had the least amount of precipitation because...
I that that _ had the most amount of precipitation because...

Answers: 2
Another question on History
History, 21.06.2019 14:30
Describe the factors that led to the truman doctrine as well as how the doctrine affected the us foreign policy
Answers: 1
History, 22.06.2019 09:50
Think local—how is the lawmaking process at a local level different from the state or federal government? use complete sentences.
Answers: 1
History, 22.06.2019 10:00
The senate differs from the house of representatives in that representatives serve for terms, while senators serve terms. question 18 options: six year, four year four year, six year two year, six year six year, two year
Answers: 1
You know the right answer?
Use the data to create a line graph with “Year” along the x-axis and “Tree Ring Width (mm)” along th...
Questions


Mathematics, 21.08.2019 21:10

Mathematics, 21.08.2019 21:10

Medicine, 21.08.2019 21:10

Biology, 21.08.2019 21:20
History, 21.08.2019 21:20
Health, 21.08.2019 21:20


