
History, 22.02.2020 01:22 cheesy2271
These maps show the population density of England at the start of the 18th and 20th Centuries. Darker colors represent a higher concentration of population.
What can be concluded from the population density of England during this time period?
A) Families were torn apart due to factory labor.
B) England's population grew during the World Wars.
C) Textile manufacturing was no longer an economic factor.
D) The Industrial Revolution led to the growth of urban areas.
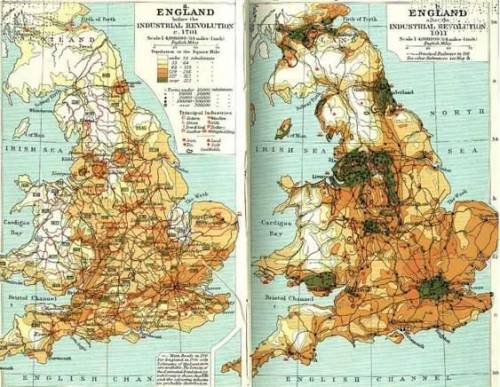

Answers: 2
Another question on History
History, 22.06.2019 00:00
Read the excerpt below and answer the question. obierika was a man who thought about things. when the will of the goddess had been done, he sat down in his obi and mourned his friend’s calamity. why should a man suffer so grievously for an offense he had committed inadvertently? (p. 125) based on the context clues, the best definition for the word “calamity” in the excerpt above is disaster sadness luck indifference
Answers: 2
History, 22.06.2019 06:00
Would creole revolutionaries tend to be democratic or authoritarian leaders?
Answers: 3
History, 22.06.2019 06:30
According to confucius the main goal of schooling was for young men to become? a. gentle men b. warriors c. monks
Answers: 2
History, 22.06.2019 12:30
How did the creation of the federal deposit insurance corporation change the nature of banking in the united states
Answers: 1
You know the right answer?
These maps show the population density of England at the start of the 18th and 20th Centuries. Darke...
Questions

Mathematics, 28.01.2021 07:30
Mathematics, 28.01.2021 07:30
Mathematics, 28.01.2021 07:40

Mathematics, 28.01.2021 07:40

English, 28.01.2021 07:40
Spanish, 28.01.2021 07:40
Mathematics, 28.01.2021 07:40
History, 28.01.2021 07:40


Geography, 28.01.2021 07:40

History, 28.01.2021 07:40
Mathematics, 28.01.2021 07:40
Mathematics, 28.01.2021 07:40


