
History, 28.06.2019 05:30 brewerroserb
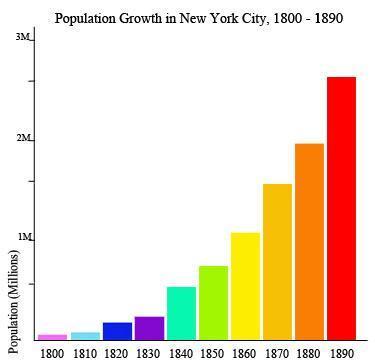
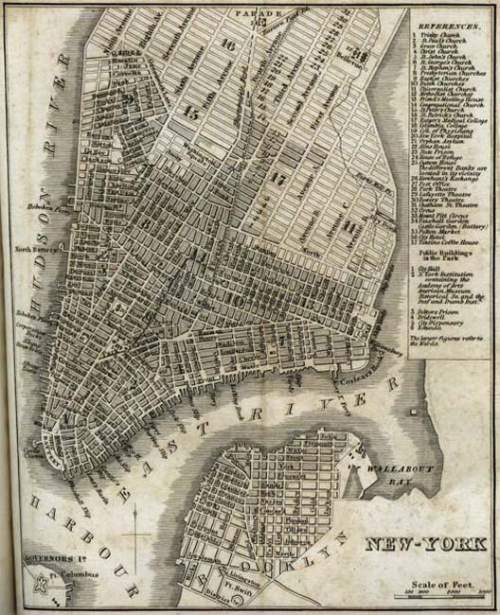
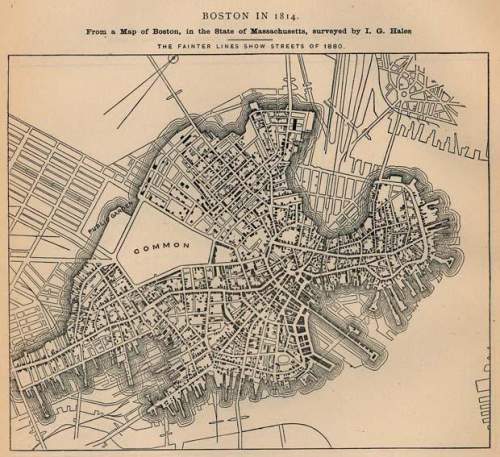
50 points and brainliest1) (first photo) use the chart titled "population growth in new york city, 1800-1890" to answer the following question: during the 1800s, the population of new york citya) shows both increases and decreasesb) increased over each decadec) decreased consistentlyd) remained steady2) (second photo) use the chart titled "population growth in new york city, 1800-1890" to answer the following question: between 1800 and 1890, the population of new york citya) decreased by more than three-quartersb) increased more than two millionc) decreased by less than two milliond) fell by more than half3) (third photo) this is a map of new york from 1842. the map shows a scale stating that one inch equals 1000 feet and the island is approximately 10 inches across. manhattan is in the middle of the map and is surrounded almost entirely by water. the hudson river is on the left and the eastern river is along the bottom and on the right. brooklyn is visible, across the east river. a legend is shown on the right side of the map, listing churches, banks, public buildings, and museums. the more populated areas are near the shore. this map supports the idea that urbanizationa) is not a process that humans have any means to controlb) led to more americans who preferred city living in the 1800sc) did not begin in the united states until after the end of the 1800sd) was more likely to occur near water for transport and energy needs4) (last photo) use the map of boston to answer the following question: this maps shows changes ina) city development over timeb) residential and business areasc) the water level surrounding bostond) amount of trade conducted in the city5) to provide clean running water, philadelphia a) purchased clean water from other major citiesb) controlled the flow of its streams with underground pipesc) built a water factory where people brought wastewater for cleaningd) urged its residents to mix salt with water to destroy bacteria before drinking


Answers: 1
Another question on History
History, 21.06.2019 22:50
How did philip ii view the religious rights of protestant citizens in his empire
Answers: 1
History, 22.06.2019 02:00
What was the main objective of the national origins act of 1924
Answers: 1
History, 22.06.2019 07:00
Which of the following statements about the economic consequences of the civil war is not accurate. a. inflation caused prices to rise by 80% in the north. b. because southern farms cannot process enough food for everyone in the south the union navy allowed food shipments from britain. c. to pay for all of the food supplies and arrangements that were necessary for the union army congress instituted an income tax. d. business boomed in the north as factories and farms always had a market for their products.
Answers: 3
History, 22.06.2019 09:00
Question 4 which of the following is an example of libel? a. an anti-war supporter advocates overthrow of the government. b. a writer for the washington post maliciously prints false information about a lawyer c. a politician screams obscenities at a reporter on the air. d. a person sets up a flag burning demonstration.
Answers: 2
You know the right answer?
50 points and brainliest1) (first photo) use the chart titled "population growth in new york city, 1...
Questions

English, 03.12.2019 19:31

Medicine, 03.12.2019 19:31

Mathematics, 03.12.2019 19:31
History, 03.12.2019 19:31
SAT, 03.12.2019 19:31

Biology, 03.12.2019 19:31
Mathematics, 03.12.2019 19:31


Physics, 03.12.2019 19:31
Mathematics, 03.12.2019 19:31
English, 03.12.2019 19:31
English, 03.12.2019 19:31


