
Geography, 28.05.2021 21:20 tabyers2645
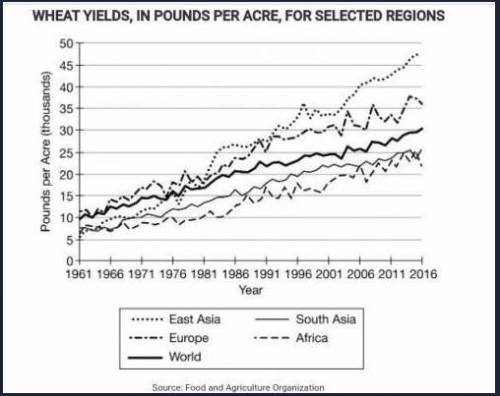
The graph shows regional and global trends in wheat farming since 1961. In this graph, the amount of wheat is measured in pounds per acre of farmland.
A. Using data on the graph, compare the wheat production trend lines of East Asia and Africa from 1961 to 1971.
B. Explain how pesticides and irrigation pumps had an effect on wheat farms in East Asia.
C. Explain how the Green Revolution had impacted farming around the world.
D. Using ONE region on the graph, explain how the changes in wheat impacted migration between farms and cities.

Answers: 1
Another question on Geography
Geography, 22.06.2019 22:50
[bws.05]where would uncharged particles be most likely found in an atom? o on the electrons o inside the protons o inside the nucleus outside the nucleus
Answers: 2
Geography, 23.06.2019 01:30
Witch of the following volcano hazards is made up of rocky particles about the size of a grain of sand
Answers: 3
Geography, 24.06.2019 00:00
Islam and the arabic language spread throughout north africa in the 600s primarily through a. african traders b. american colonists c. european explorers d. middle eastern armies select the best answer from the choices provided
Answers: 2
You know the right answer?
The graph shows regional and global trends in wheat farming since 1961. In this graph, the amount of...
Questions


Mathematics, 12.12.2020 16:50
Mathematics, 12.12.2020 16:50
Mathematics, 12.12.2020 16:50
Mathematics, 12.12.2020 16:50

Health, 12.12.2020 16:50
Mathematics, 12.12.2020 16:50

History, 12.12.2020 16:50

Chemistry, 12.12.2020 16:50
Mathematics, 12.12.2020 16:50
Mathematics, 12.12.2020 16:50


