Create isobars.
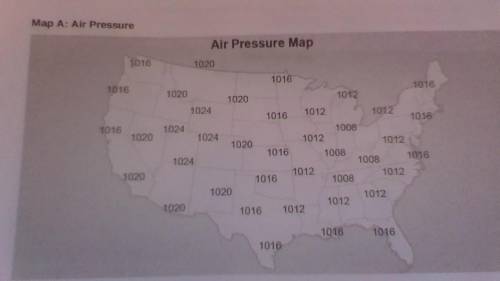
Use Map A located in the Data section.
Start by connecting the points o...

Geography, 17.05.2021 21:20 michelle8978
Create isobars.
Use Map A located in the Data section.
Start by connecting the points of highest air pressure. Draw a line to all the points with the same air pressure. Remember, isobars are smooth, rounded lines—not straight, jagged lines.
Repeat Step b for each air pressure measurement.
Label each isobar with the air pressure measurement.
Label the high pressure area on the map in red.
Label the low pressure area on the map in blue.
Recall the information you learned in the lesson about high and low pressure and weather patterns. Color areas where you expect to see rain or snow purple.
Color areas where you expect to see clear skies red.
-
THANK YOU

Answers: 1
Another question on Geography
Geography, 22.06.2019 23:00
In the developed world, describe the changing role of women in agriculture.
Answers: 1
Geography, 23.06.2019 12:50
Suggest 3 different reasons why there is an ageing population in the uk .
Answers: 1
You know the right answer?
Questions


Mathematics, 06.05.2020 23:16
Mathematics, 06.05.2020 23:16


Mathematics, 06.05.2020 23:16
English, 06.05.2020 23:16
Mathematics, 06.05.2020 23:16

Mathematics, 06.05.2020 23:16


