
Geography, 20.01.2021 20:10 aschool2000
Part B
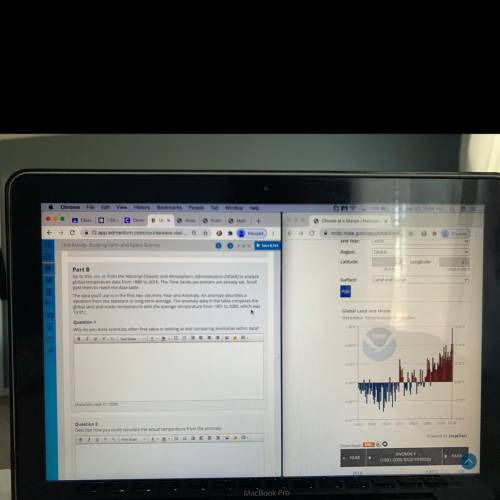
Go to this site e from the National Oceanic and Atmospheric Administration (NOAA) to analyze
global temperature data from 1880 to 2016. The Time Series parameters are already set. Scroll
past them to reach the data table.
The data you'll use is in the first two columns: Year and Anomaly. An anomaly describes a
deviation from the standard or long-term average. The anomaly data in the table compares the
global land and ocean temperature with the average temperature from 1901 to 2000, which was
13.9°C.
Question 1
Why do you think scientists often find value in looking at and comparing anomalies within data?
B I U x X Font Sizes
A-
A
1
Characters used: 0 / 15000

Answers: 1
Another question on Geography
Geography, 23.06.2019 15:20
All of the following actions are examples of civil disobedience, except a.) refusing to pay an unfair tax b.) refusing to use government services c.) participating in a protest march d.)planning a riot to destroy a government riot
Answers: 1
Geography, 23.06.2019 23:30
The action of eventually a low island to form. a. wind b. waves c. volcanoes d. tectonic plates
Answers: 1
Geography, 24.06.2019 02:00
Afathom is a unit of length, usually reserved for measuring the depth of water. a fathom is approximately 6 ft in length. take the distance from earth to the moon to be 230,000 miles, and use the given approximation to find the distance in fathoms.
Answers: 1
You know the right answer?
Part B
Go to this site e from the National Oceanic and Atmospheric Administration (NOAA) to analyze...
Questions

Social Studies, 06.05.2020 05:07


Mathematics, 06.05.2020 05:07

Computers and Technology, 06.05.2020 05:07
Mathematics, 06.05.2020 05:07
Mathematics, 06.05.2020 05:07
Physics, 06.05.2020 05:07

History, 06.05.2020 05:07

Biology, 06.05.2020 05:07


