
Geography, 17.11.2020 01:40 lilinicholeb
Analyze the chart below and answer the question that follows.
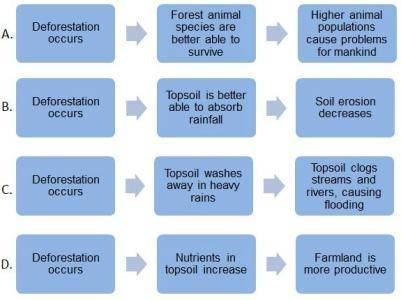
A chart with 12 bubbles with arrows pointing to the next bubble and 3 bubbles in each row. Row A is Deforestation occurs, Forest animal species are better able to survive, Higher animal populations cause problems for mankind. Row B is Deforestation occurs, Topsoil is better able to absorb rainfall, Soil erosion decreases. Row C is Deforestation occurs, Topsoil washes away in heavy rains, Topsoil clogs streams and rivers causing flooding. Row D is Deforestation occurs, Nutrients in topsoil increase, Farmland is more productive.
Image by e2020
In the chart above, which of the sequences describes a negative consequence of deforestation?
A.
Sequence A
B.
Sequence B
C.
Sequence C
D.
Sequence D
Please select the best answer from the choices provided
A
B
C
D

Answers: 3
Another question on Geography
Geography, 22.06.2019 22:40
Which of the following terms describes the layers of air surrounding the earth ?
Answers: 1
Geography, 23.06.2019 10:00
Which city area has the most accessible oil reserves a) caspian sea b) siberia c)arctic coast d)lake baikal
Answers: 1
Geography, 24.06.2019 06:30
Where does the availability of water pose the greatest problem
Answers: 3
You know the right answer?
Analyze the chart below and answer the question that follows.
A chart with 12 bubbles with arrows p...
Questions


Mathematics, 07.10.2019 16:30

Biology, 07.10.2019 16:30
Geography, 07.10.2019 16:30
Geography, 07.10.2019 16:30
Biology, 07.10.2019 16:30
English, 07.10.2019 16:30

History, 07.10.2019 16:30
Mathematics, 07.10.2019 16:30


