100 POINTS NEED HELP :)
Meteorology Lab Report
Introduction
Meteorologists draw...

100 POINTS NEED HELP :)
Meteorology Lab Report
Introduction
Meteorologists draw conclusions based on all known weather data. Since weather data is constantly changing, their forecast can change from day to day or from hour to hour. Now, it is your turn to predict the weather. In this lab activity, you will analyze data collected from a weather station to create a weather forecast.
Problem:
How can we use the relationships among weather data to produce a forecast?
Hypothesis/Prediction:
Based on the weather data you in Table 1 below, make a prediction about the weather from the data by completing the sentences below.. Make sure your prediction is made before you create graphs of your weather data.
If temperature _ increases/decreases, then the dew point will _increase/decrease.
If temperature _ increases/decreases, then air pressure will _ increase/decrease.
Materials:
Weather data in Table 1
Weather Maps Symbols Key (see lesson)
Graphing software or application
Graphing tutorial (optional)
Procedures:
Using the Weather Data from Table 1, construct a line graph using Time on the X axis and Temperature for the Y axis. Make sure to plot both the temperature and dew point on your graph. Be sure to include units and add titles to the graphs. Refer to the graph example and graphing tutorial in the lesson if needed.
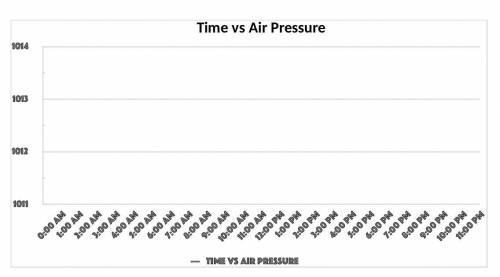
Using the Weather Data from Table 1, construct a second line graph using Time on the X axis and Air Pressure for the Y axis. Be sure to include units and add titles to the graphs.
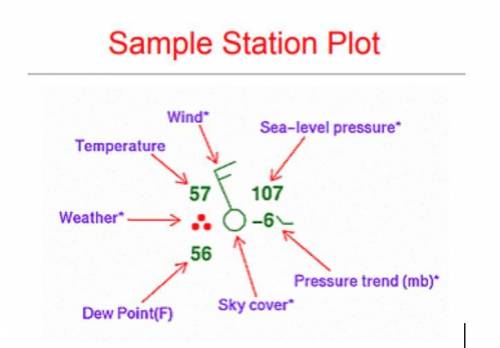
Select two different times (one day and one night) from Table 1 and create a weather station model for each. Use the example diagram in the data sections and the Weather Map Symbol Key in the lesson to guide your weather station models.
Complete the Questions and Conclusion section of the lab report.
Graph 1
You may plot the data by hand on the template below or follow the steps below to create your graph.
Double click on the graph, then select the tab labeled “sheet 1”.
Input the data from Table 1 in the corresponding columns on the spreadsheet.
Once you have input all corresponding data, select the tab labeled “Chart” at the bottom of the table to display your line graphs.
Graph 2
You may plot the data by hand on the template below or follow the steps below to create your graph.
Double click on the graph, then select the tab labeled “sheet 1”.
Input the data from Table 1 in the corresponding columns on the spreadsheet.
Once you have input all corresponding data, select the tab labeled “Chart” at the bottom of the table to display your line graphs.
Data and Observations:
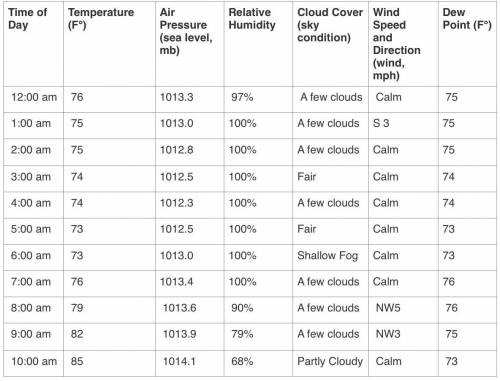
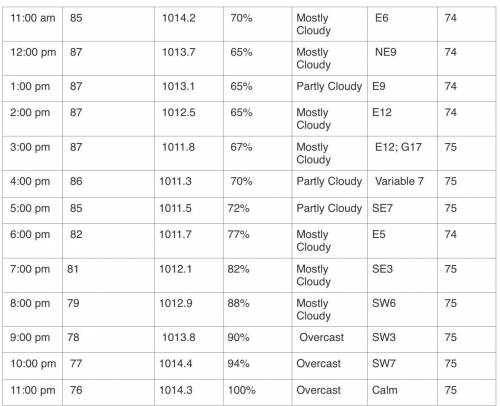
Table 1: Weather Data from Station 1, Cape Canaveral, Florida
Select two different times (one day and one night) from Table 1 and create a weather station model for each. Use the Weather Map Symbols Key from the lesson to guide your weather station models. An example is shown below. Place your weather station models under the data for each time.
DAY: _ (Time)
1. Temperature: _
2. Dew Point: _
3. Air Pressure: _ mb
4. Wind Direction—Choose One: N, NE, E, SE, S, SW, NW W
5. Wind Speed: _
6. Cloud Cover—Choose One: CLR 0%, FEW 25%, SCT 50%, BKN 75%, OVC 100%
Place Weather Station Model here.
NIGHT: _ (Time)
1. Temperature: _
2. Dew Point: _
3. Air Pressure: _mb
4. Wind Direction—Choose One: N, NE, E, SE, S, SW, NW W
5. Wind Speed: _
6. Cloud Cover—Choose One: CLR 0%, FEW 25%, SCT 50%, BKN 75%, OVC 100%
Place Weather Station Model here.
Questions and Conclusion
Write a summary of the weather that occurred during the 24 hours in Table 1.
What are the possible sources of error in the weather data?
Based on your graphs, what relationships do you notice between temperature, dew point, humidity, cloud cover, and air pressure? Provide evidence of your conclusion.

Answers: 1
Another question on Chemistry
Chemistry, 23.06.2019 03:30
Name atleast 3 type of energy associated with the microwave
Answers: 1
Chemistry, 23.06.2019 04:00
Why must humans find substitutes for many minerals found on earth? (a) form at an extremely slow rate (b) controlled by other countries (c) too deep in the earth to collect
Answers: 1
Chemistry, 23.06.2019 08:40
Which statement is true according to the kinetic theory? a. molecules of different gases with the same mass and temperature always have the same average density. b. molecules of different gases with the same mass and temperature always have the same average volume. c. molecules of different gases with the same mass and temperature always have the same pressure. d. molecules of different gases with the same mass and temperature always have the same molecular mass. e. molecules of different gases with the same mass and temperature always have the same average kinetic energy.
Answers: 1
You know the right answer?
Questions

History, 06.10.2019 09:01


Mathematics, 06.10.2019 09:01

Social Studies, 06.10.2019 09:01
Mathematics, 06.10.2019 09:01

Geography, 06.10.2019 09:01
Mathematics, 06.10.2019 09:01
Chemistry, 06.10.2019 09:01
Mathematics, 06.10.2019 09:01
Biology, 06.10.2019 09:01
Mathematics, 06.10.2019 09:01


