
Chemistry, 20.07.2021 01:00 denvontgekingice
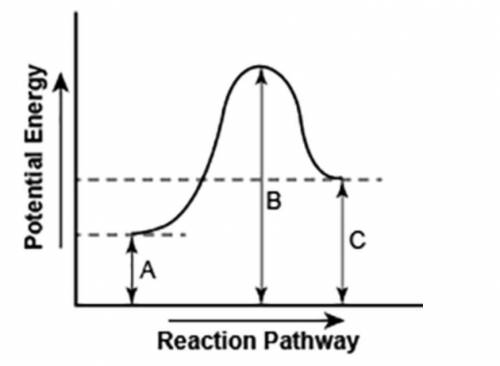
The diagram shows the potential energy changes for a reaction pathway. (10 points)
A curve line graph is shown. The y axis of the graph has the title Potential Energy. The x axis of the graph has the title Reaction Pathway. The curve begins at a lower level and ends at a slightly higher level. A vertical line labeled A, starts from the x axis till the beginning of the graph line. A vertical line labeled B starts from the x axis and continues till the peak of the graph. Another vertical line labeled C is shown from the x axis till the point where the curve ends.
Part 1: Does the diagram illustrate an endothermic or an exothermic reaction? Give reasons in support of your answer.
Part 2: Describe how you can determine the total change in enthalpy and activation energy from the diagram and if each is positive or negative.

Answers: 2
Another question on Chemistry
Chemistry, 22.06.2019 11:00
Which statement is true about hcl? (5 points) select one: a. it is a salt because it increases the concentration of metallic ions. b. it is a salt because it is formed by the reaction of an acid and a base. c. it is an acid because it increases the concentration of hydroxyl ions. d. it is an acid because it increases the concentration of hydronium ions.
Answers: 1
Chemistry, 22.06.2019 14:00
In the space, show a correct numerical setup for calculating the number of moles of co2 present in 11 grams of co2
Answers: 1
Chemistry, 22.06.2019 17:30
Energy defines the different "states" of matter. in no more than 3 sentences, describe the amount of kinetic energy that each of the 3 states of matter possesses and relate that to the atom/molecular motion of each "state".
Answers: 2
Chemistry, 22.06.2019 21:30
Electromagnets coils of wire paper clips picked up 10 3 15 6 20 9 25 12 ms. owens' class was studying magnets. ms. owens showed her students how to make an electromagnet using a nail, a d-cell battery, and plastic coated wire. the students wrapped the wire around the nail and then attached the ends to the battery. when they were finished, they tested their magnets by investigating how many paperclips their magnets could pick up. they also tested whether they could increase the strength of their electromagnets by using more coils of wire. they recorded the class average of their results in the data table seen here. ms. owens asked her students to graph their data in a line graph. how should the students label the x-axis on their line graph? a) size of battery b) number of paper clips c) number of coils of wire d) strength of electromagnet
Answers: 2
You know the right answer?
The diagram shows the potential energy changes for a reaction pathway. (10 points)
A curve line gra...
Questions


Mathematics, 23.06.2019 22:00
Mathematics, 23.06.2019 22:00

English, 23.06.2019 22:00

Mathematics, 23.06.2019 22:00
Mathematics, 23.06.2019 22:00

History, 23.06.2019 22:00


