The graph shows the solubility curve
of a substance A, at 1 atm and at different
temperatures...

Chemistry, 14.04.2021 17:00 saraderrico
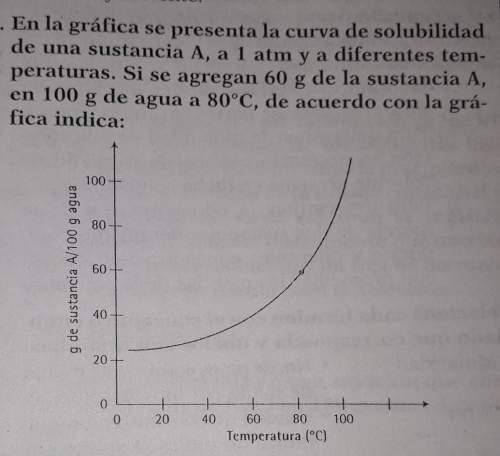
The graph shows the solubility curve
of a substance A, at 1 atm and at different
temperatures. If 60 gr of the substance are added
An in 100 g of water at 80 ºC, according to the
graph
a) Substance A is completely dissolved
b) Solute precipitation occurs
c) Classify the solution as unsaturated, saturated or
supersaturated as the case may justify your
answer.

Answers: 3
Another question on Chemistry
Chemistry, 22.06.2019 05:40
Fill in the coefficients that will balance the following reaction: a0cr2(so4)3 + a1agno3
Answers: 3
Chemistry, 22.06.2019 11:50
Calculate the molarity of each of the following solutions. part a) 0.12 mol of lino3 in 5.5 l of solution part b) 60.7 g c2h6o in 2.48 l of solution part c) 14.2 mg ki in 100 ml of solution
Answers: 2
Chemistry, 22.06.2019 12:00
An atom's configuration based on its number of electrons ends at 3p4. another atom has seven more electrons. starting at 3p, what is the remaining configuration? 3p63d34s2 3p43d54s2 3p64s23d3 3p44s23d
Answers: 3
You know the right answer?
Questions


Mathematics, 09.04.2020 20:22

Chemistry, 09.04.2020 20:23
History, 09.04.2020 20:23

Social Studies, 09.04.2020 20:23
Mathematics, 09.04.2020 20:23
English, 09.04.2020 20:23


Spanish, 09.04.2020 20:23

Mathematics, 09.04.2020 20:23


