
Chemistry, 02.03.2021 14:00 iceecole6570
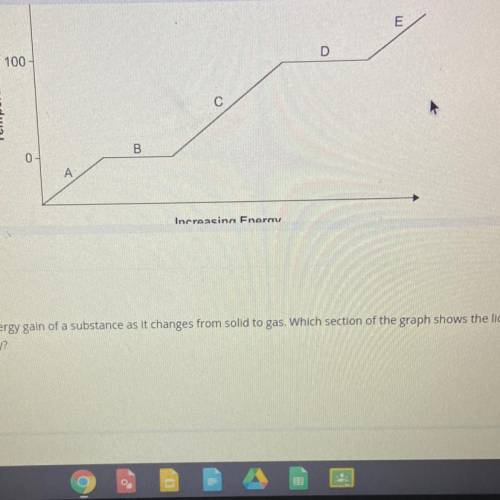
The heating curve shows the energy gain of a substance as it changes from solid to gas. Which section of graph shows the liquid phase of a substance gaining kinectic energy ?

Answers: 1
Another question on Chemistry
Chemistry, 21.06.2019 20:10
What can be added to the examples section of each circle? endothermic: ice melting into water, and a heat pack becoming warm exothermic: a glow stick glowing, and fireworks exploding endothermic: ice melting into water, and an instant ice pack turning cold exothermic: fireworks exploding, and gasoline burning endothermic: a glow stick glowing, and a heat pack becoming warm exothermic: an instant ice pack turning cold, and ice melting into water endothermic: gasoline burning, and an instant ice pack turning cold exothermic: ice melting into water, and an instant ice pack turning cold
Answers: 1
Chemistry, 22.06.2019 00:30
Asolution of sodium hydroxide was titrated against a solution of sulfuric acid. how many moles of sodium hydroxide would react with 1 mole of sulfuric acid?
Answers: 2
Chemistry, 22.06.2019 12:10
If a molecule with a molecular formula of c13h18 is treated with an excess of h2 in the presence of finally divided pt metal under conditions required for maximum hydrogenation of the molecule to give a molecule with a formula c13h24, how many rings are in the molecule?
Answers: 3
You know the right answer?
The heating curve shows the energy gain of a substance as it changes from solid to gas. Which sectio...
Questions

Business, 27.05.2021 17:50


Mathematics, 27.05.2021 17:50

Computers and Technology, 27.05.2021 17:50
Mathematics, 27.05.2021 17:50
English, 27.05.2021 17:50
Mathematics, 27.05.2021 17:50
Mathematics, 27.05.2021 17:50

Advanced Placement (AP), 27.05.2021 17:50
Mathematics, 27.05.2021 17:50

Chemistry, 27.05.2021 17:50

Health, 27.05.2021 17:50

Advanced Placement (AP), 27.05.2021 17:50


