
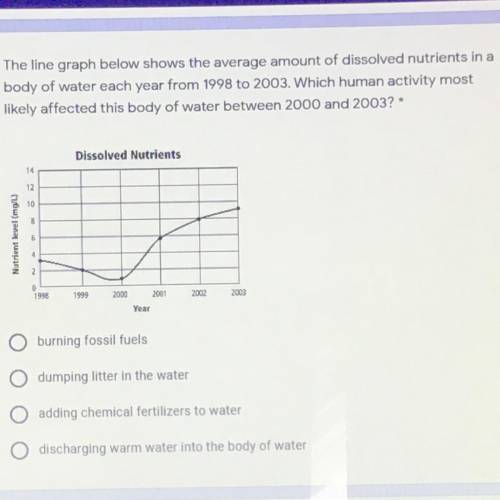
The line graph below shows the average amount of dissolved nutrients in a 1 point
body of water each year from 1998 to 2003. Which human activity most
likely affected this body of water between 2000 and 2003? *
Dissolved Nutrients
14
12
10
Nutrient leveling
4
2
1998
1999
2000
2002
2003
2001
Year
burning fossil fuels
dumping litter in the water
adding chemical fertilizers to water
discharging warm water into the body of water
plz help

Answers: 3
Another question on Chemistry
Chemistry, 22.06.2019 01:20
1. suppose a reaction mixture, when diluted with water, afforded 300 ml of an aqueous solution of 30 g of the reaction product malononitrile [ch2(cn)2], which is to be isolated by extraction with ether. the solubility of malononitrile in ether at room temperature is 20.0 g/100 ml, and in water is 13.3 g/100 ml. what weight of malononitrile would be recovered by extraction with (a) three 100-ml portions of ether and (b) one 300-ml portion of ether? suggestion: for each extraction, let x equal the weight extracted into the ether layer. in part (a), the concentration in the ether layer is x/100 and in the water layer is (30 x)/300; the ratio of these quantities is equal to k 20/13.3.
Answers: 2
Chemistry, 22.06.2019 05:40
Consider the elements bromine and chlorine; which elements has a larger ionic radius ?
Answers: 1
Chemistry, 22.06.2019 07:20
Part b: study of equilibrium on solubility: mg(oh)2(s) ⇌ mg2+(aq) + 2 oh–(aq) cloudy clear (pink) 7. a. b. 8. a. b. 9. 10. 11. 12. when adding concentrated hydrochloric acid, how did the appearance of the equilibrium mixture change? the change in appearance indicated a shift in the point of equilibrium. in which direction did the equilibrium shift? (l) left (r) right explain your answer to question 7a. you should indicate which ion was added to or removed from the equilibrium mixture. when adding edta, how did the appearance of the equilibrium mixture change? the change in appearance indicated a shift in the point of equilibrium. in which direction did the equilibrium shift? (l) left (r) right explain your answer to question 8a. you should indicate which ion was added to or removed from the equilibrium mixture. upon heating in which direction is the equilibrium shifting? upon cooling in which direction is the equilibrium shifting? is the forward reaction a. endothermic explain your answers to questions 9, 10, and 11. (l) left (r) right (l) left (r) right b. exothermic
Answers: 1
You know the right answer?
The line graph below shows the average amount of dissolved nutrients in a 1 point
body of water eac...
Questions

Mathematics, 11.10.2020 08:01

Mathematics, 11.10.2020 08:01
Physics, 11.10.2020 08:01


Health, 11.10.2020 08:01
Biology, 11.10.2020 08:01
Biology, 11.10.2020 08:01

Chemistry, 11.10.2020 08:01

Mathematics, 11.10.2020 08:01


