
Chemistry, 29.08.2020 23:01 drivinghydra
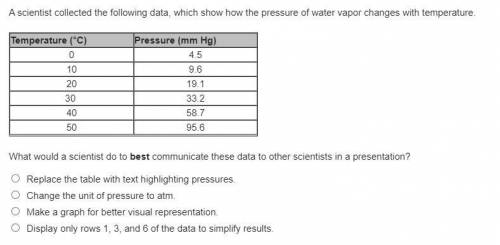
A scientist collected the following data, which show how the pressure of water vapor changes with temperature.
Temperature (°C) Pressure (mm Hg) 0 4.5 10 9.6 20 19.1 30 33.2 40 58.7 50 95.6
What would a scientist do to best communicate these data to other scientists in a presentation?
Replace the table with text highlighting pressures.
Change the unit of pressure to atm.
Make a graph for better visual representation.
Display only rows 1, 3, and 6 of the data to simplify results.

Answers: 2
Another question on Chemistry
Chemistry, 22.06.2019 10:00
According to the tide table below what time of day will the highest tide occur? (2 pt) the highest tide will occur at
Answers: 1
Chemistry, 23.06.2019 08:00
Drag each pressure unit with the corresponding number to describe standard atmospheric pressure
Answers: 1
Chemistry, 23.06.2019 08:40
Calculate the number of grams of sodium in 3.00 g of each sodium-containing food additive.
Answers: 3
You know the right answer?
A scientist collected the following data, which show how the pressure of water vapor changes with te...
Questions


Social Studies, 28.01.2020 06:31

History, 28.01.2020 06:31
History, 28.01.2020 06:31

Mathematics, 28.01.2020 06:31
Mathematics, 28.01.2020 06:31
Mathematics, 28.01.2020 06:31


Arts, 28.01.2020 06:31


