Data Analysis
In Excel, plot the ELISA results using absorbance on the Y axis and th
conce...

Chemistry, 08.03.2020 00:41 TravKeepIt100
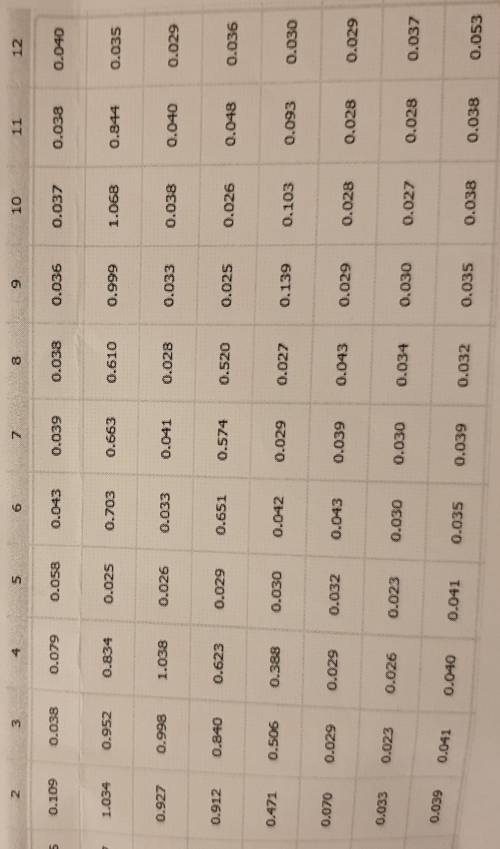
Data Analysis
In Excel, plot the ELISA results using absorbance on the Y axis and th
concentrations of the serial dilution samples on the X axis (use a log scale). Th
concentrations of these samples can be calculated from the concentration of th
stock solution. This will be your standard curve. Add a line of best fit to your standard
curve and use the equation of the line to calculate the concentration of ACP
antibodies in your patient and healthy control samples
these are basically my results but how do I do the top question?

Answers: 3
Another question on Chemistry
Chemistry, 22.06.2019 04:00
You encounter a solution that is acidic and you decide to test it by adding a small amount of a strong acid. the ph lowers slightly but is approximately unchanged, and still remains acidic. what can you say about the solution? a. it is a buffer solution. b. it is not a buffer solution it is a strong acid solution. d. the solution has been neutralized. e. the solution has excess acid present
Answers: 1
Chemistry, 22.06.2019 21:00
Read "who built the pyramids? ”. leave this link open while you answer the questions throughout the assignment. give at least two reasons why some people claim the pyramids of giza were constructed by aliens.
Answers: 1
You know the right answer?
Questions


Business, 29.08.2020 04:01

Mathematics, 29.08.2020 04:01
Mathematics, 29.08.2020 04:01


Social Studies, 29.08.2020 04:01
Business, 29.08.2020 04:01
Engineering, 29.08.2020 04:01


