The graph shows a sample of gas when it is hot, cold, and at room temperature.
three gra...

Chemistry, 21.12.2019 01:31 tayjohn9774
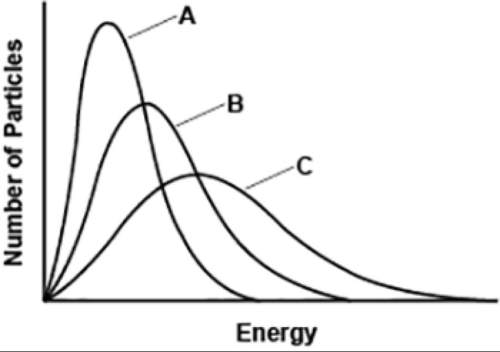
The graph shows a sample of gas when it is hot, cold, and at room temperature.
three graphs are plotted with number of particles on the y axis and energy on the x axis. all three graphs are smooth curves which rise up and then come down. the leftmost curve is the highest and is labeled a. the rightmost curve is labeled c and is the lowest. the curve in the middle is labeled b and has a height less than a and greater than c.
which statement is correct about curves b and c?
b represents hot gas and c represents gas at room temperature.
b represents gas at room temperature and c represents hot gas.
b represents gas at room temperature and c represents cold gas.
b represents cold gas and c represents gas at room temperature.

Answers: 1
Another question on Chemistry
Chemistry, 22.06.2019 08:30
How does the principle of electromagnetism explain the interaction between earth’s magnetic field and the solar wind?
Answers: 1
Chemistry, 22.06.2019 19:20
The equation picture below shows which type of nuclear reaction u 235 + n x e 134 + sr 100 + 2n
Answers: 1
Chemistry, 22.06.2019 21:30
How can the periodic table be used to predict the behavior of elements?
Answers: 1
You know the right answer?
Questions


Biology, 21.06.2019 20:00
Biology, 21.06.2019 20:00


Biology, 21.06.2019 20:00


Computers and Technology, 21.06.2019 20:00
Mathematics, 21.06.2019 20:00
Biology, 21.06.2019 20:00


Social Studies, 21.06.2019 20:00


