
Business, 26.03.2021 05:30 lisagrimmett3
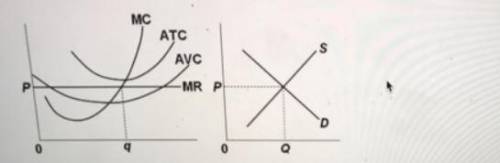
Refer to the diagrams, which pertain to a purely competitive firm producing output q and the industry in which it operates. In the long run we should expect: Multiple Choice firms to enter the industry, market supply to rise, and product price to fall. firms to leave the industry, market supply to rise, and product price to fall. firms to leave the industry, market supply to fall, and product price to rise. no change in the number of firms in this industry.

Answers: 1
Another question on Business
Business, 22.06.2019 09:30
Which are the best examples of costs that should be considered when creating a project budget?
Answers: 2
Business, 22.06.2019 21:00
Suppose either computers or televisions can be assembled with the following labor inputs: units produced 1 2 3 4 5 6 7 8 9 10 total labor used 3 7 12 18 25 33 42 54 70 90 (a) draw the production possibilities curve for an economy with 54 units of labor. label it p54. (b) what is the opportunity cost of the eighth computer? (c) suppose immigration brings in 36 more workers. redraw the production possibilities curve to reflect this added labor. label the new curve p90.
Answers: 2
Business, 23.06.2019 10:40
what is your question? 1 high schoolbusiness 5 points imagine that you have won $100 in the state lottery. you have a choice between spending the money on shopping now or putting it away in a savings account for one year. you decide to spend the money now on shopping. thus, you will lose the interest that you could have earned by saving the money. the lost interest is cost of spending money now.
Answers: 3
Business, 23.06.2019 16:30
5. real versus nominal gdp consider a simple economy that produces two goods: cupcakes and muffins. the following table shows the prices and quantities of the goods over a three-year period. year cupcakes muffins price quantity price quantity (dollars per cupcake) (number of cupcakes) (dollars per muffin) (number of muffins) 2014 2 115 5 175 2015 4 150 2 180 2016 1 100 2 160 use the information from the preceding table to fill in the following table. year nominal gdp real gdp gdp deflator (dollars) (base year 2014, dollars) 2014 2015 2016 from 2015 to 2016, nominal gdp , and real gdp . the inflation rate in 2016 was . why is real gdp a more accurate measure of an economy's production than nominal gdp? real gdp does not include the value of intermediate goods and services, but nominal gdp does. real gdp measures the value of the goods and services an economy produces, but nominal gdp measures the value of the goods and services an economy consumes. real gdp is not influenced by price changes, but nominal gdp is.
Answers: 1
You know the right answer?
Refer to the diagrams, which pertain to a purely competitive firm producing output q and the industr...
Questions

Mathematics, 15.10.2020 06:01


Advanced Placement (AP), 15.10.2020 06:01

Mathematics, 15.10.2020 06:01

Law, 15.10.2020 06:01
Mathematics, 15.10.2020 06:01
Mathematics, 15.10.2020 06:01

Mathematics, 15.10.2020 06:01
Advanced Placement (AP), 15.10.2020 06:01

Physics, 15.10.2020 06:01

Chemistry, 15.10.2020 06:01


