
Business, 12.10.2020 17:01 yuki430p7szcq
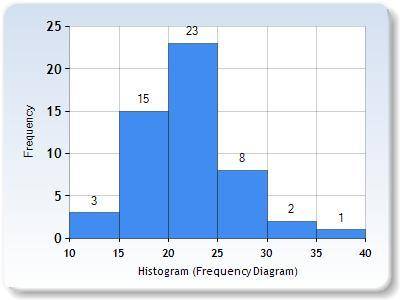
Suppose Procter & Gamble sells about 20 million bars of soap per week, but the demand is not constant and production management would like to get a better handle on how sales are distributed over the year. Let the following sales figures given in units of million bars represent the sales of bars per week over 1 year (in no particular order).
17.1 22.3 17 25.2 19.6 12.2 18.3 26.3 15.4 19.9 13.6 23.9 17.4 21.5 39.8 30.6 15 20.4 20.7 25.2 18.5 20.3 21.3 26.2 20.6 15.5 22.5 26.9 18.4 23.6 21.4 32.8 20 19.1 23.4 26.3 20.9 20.4 23.1 26.6 19.3 15.4 22.8 24.3 18.2 20.3 21.4 26.2 14.7 24.4 24 23.8
Required:
a. Construct a histogram chart to represent the data.
b. Creating a chart is not useful in and of itself unless it is properly interpreted. Write a brief analysis of the graph. What do you see in the graph that might be helpful to the production and sales people?

Answers: 1
Another question on Business
Business, 21.06.2019 21:50
Discuss how the resource-based view (rbv) of the firm combines the two perspectives of (1) an internal analysis of a firm and (2) an external analysis of its industry and its competitive environment. include comments on the different types of firm resources and how these resources can be used by a firm to build sustainable competitive advantages.
Answers: 3
Business, 22.06.2019 04:40
What is ur favorite song and by who i know dis is a random question
Answers: 2
Business, 22.06.2019 14:40
Which of the following would classify as a general education requirement
Answers: 1
Business, 22.06.2019 20:40
David consumes two things: gasoline (g) and bread (b). david's utility function is u(g, b) = 10g^0.25 b^0.75. use the lagrange technique to solve for david's optimal choices of gasoline and bread as a function of the price of gasoline, p_g, the price of bread, p_b, and his income m. with recent decrease in the price of gasoline (maybe due to external shock such as shale gas production) does david increase his consumption of gasoline? for david, how does partial differential g/partial differential p_g depend on his income m? that is, how does david's change in gasoline consumption due to an increase in the price of gasoline depend on his income level? to answer these questions, find the cross-partial derivative, |partial differential^2 g/partial differential m partial differential p_g.
Answers: 1
You know the right answer?
Suppose Procter & Gamble sells about 20 million bars of soap per week, but the demand is not con...
Questions

Mathematics, 09.07.2019 03:00


Chemistry, 09.07.2019 03:00

Mathematics, 09.07.2019 03:00
Mathematics, 09.07.2019 03:00


Social Studies, 09.07.2019 03:00
Mathematics, 09.07.2019 03:00
Mathematics, 09.07.2019 03:00
Mathematics, 09.07.2019 03:00
Mathematics, 09.07.2019 03:00

Computers and Technology, 09.07.2019 03:10


