
Business, 18.08.2020 23:01 tevaughn06
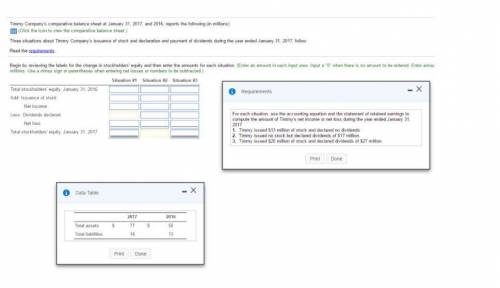
Timmy Company's comparative balance sheet at January 31, 2017, and 2016. reports the following (in millions):
Three situations about Timmy Company's issuance of stock and declaration and payment of dividends during the year ended January 31, 2017.
follow. Read the requirements.
Begin by reviewing the labels for the change in stockholders' equity and then enter the amounts for each situation. (Enter an amount in each input area. Input a "0" when there is no amount to be entered. Enter amount millions. Use a minus sign or parentheses when entering net losses or numbers to be subtracted.)
Total stockholders' equity, January 31, 2016
Add: Issuance of stock
Net income
Less: Dividends declared
Net loss
Total stockholders' equity, January 31, 2017
For each situation, use the accounting equation and the statement of retained earnings to compute the amount of Timmy's net income or net loss during the year ended January 31 2017.
1. Timmy issued $13 million of stock and declared no dividends.
2. Timmy issued no stock but declared dividends of $17 million.
3. Timmy issued $20 million of stock and declared dividends of $27 million.

Answers: 2
Another question on Business
Business, 21.06.2019 19:30
What is the most important factor that affects the value of a company? a) cash flow b) earnings c) supply and demand d) number of employees
Answers: 1
Business, 22.06.2019 18:00
When peter metcalf describes black diamond’s manufacturing facility in china as a “greenfield project,” he means that partnered with a chinese company to buy the plant . of all market entry strategies, this one carries the lowest risk. because black diamond manufactures its outdoor sports products outside the united states, what risks must its managers be aware of?
Answers: 1
Business, 22.06.2019 19:00
The demand curve determines equilibrium price in a market. is a graphical representation of the relationship between price and quantity demanded. depicts the relationship between production costs and output. is a graphical representation of the relationship between price and quantity supplied.
Answers: 1
Business, 22.06.2019 19:50
Managers in a firm hired to improve the firm's profitability and ultimately the shareholders' value will add to the overall costs if they pursue their own self-interests. what does this best illustrate? a. diseconomies of scale b. principal-agent problem c. experience-curveeffects d. information asymmetries
Answers: 1
You know the right answer?
Timmy Company's comparative balance sheet at January 31, 2017, and 2016. reports the following (in m...
Questions

History, 15.12.2020 01:00

History, 15.12.2020 01:00

Mathematics, 15.12.2020 01:00


Social Studies, 15.12.2020 01:00
History, 15.12.2020 01:00
English, 15.12.2020 01:00
Mathematics, 15.12.2020 01:00
English, 15.12.2020 01:00


Biology, 15.12.2020 01:00


