
Business, 19.05.2020 14:01 fatherbamboo
Construct profit diagrams or profit tables on expiration to show what position in IBM puts, calls and/or underlying stock best expresses the investor’s objectives described below. Assume IBM currently sells for $150 so that profit diagrams/ tables between $100 and $200 (in $10 increments) are appropriate. Also assume that "at the money" puts and calls cost $15 each. (As usual, the profit calculations ignore dividends and interest.)
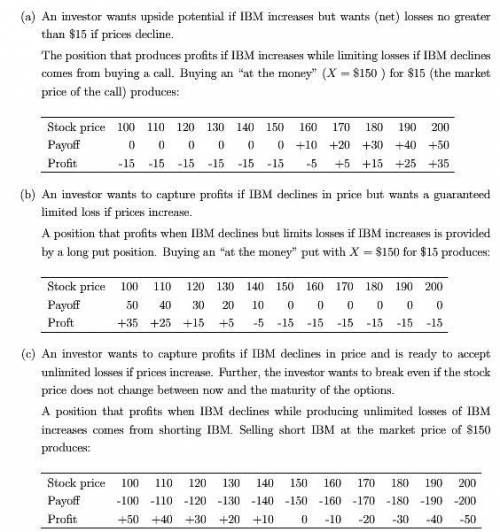
(a) An investor wants upside potential if IBM increases but wants (net) losses no greater than $15 if prices decline.
(b) An investor wants to capture prots if IBM declines in price but wants a guaranteed limited loss if prices increase.
(c) An investor wants to capture prots if IBM declines in price and is ready to accept unlimited losses if prices increase. Further, the investor wants to break even if the stock price does not change between now and the maturity of the options.
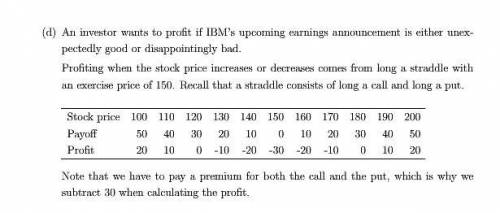
(d) An investor wants to prot if IBM's upcoming earnings announcement is either unexpectedly good or disappointingly bad.

Answers: 1
Another question on Business
Business, 21.06.2019 22:30
For many years, kellogg's frosted flakes, a ready-to-eat breakfast cereal, was perceived as a cereal for children. tony the tiger, a cartoon character, extolled frosted flakes, and advertisements depicted children enjoying the product with tony in competitive situations. recently, in response to declining sales of frosted flakes, the cereal maker has adopted a new series of advertisements that show adults admitting that they enjoy frosted flakes, too. kellogg's is attempting to
Answers: 1
Business, 22.06.2019 13:20
Suppose your rich uncle gave you $50,000, which you plan to use for graduate school. you will make the investment now, you expect to earn an annual return of 6%, and you will make 4 equal annual withdrawals, beginning 1 year from today. under these conditions, how large would each withdrawal be so there would be no funds remaining in the account after the 4th withdraw?
Answers: 3
Business, 23.06.2019 15:30
10. problems and applications q10 a market is described by the following supply-and-demand curves: qsqs = = 2p2p qdqd = = 300â’p300â’p the equilibrium price is $ and the equilibrium quantity is . suppose the government imposes a price ceiling of $90. this price ceiling is , and the market price will be $ . the quantity supplied will be , and the quantity demanded will be . therefore, a price ceiling of $90 will result in . suppose the government imposes a price floor of $90. this price floor is , and the market price will be $ . the quantity supplied will be and the quantity demanded will be . therefore, a price floor of $90 will result in . instead of a price control, the government levies a tax on producers of $30. as a result, the new supply curve is: qsqs = = 2(pâ’30)2pâ’30 with this tax, the market price will be $ , the quantity supplied will be , and the quantity demanded will be . the passage of such tax will result in .
Answers: 1
Business, 23.06.2019 18:50
Acme foods wants to make its chips saltier, but it doesn't want to spend more than it has to on salt. a sample of consumers are asked to compare its current chip (saltiness = 100) with saltier versions and to say whether the new version is saltier. on average, sample consumers reliably say the new chip is saltier when its saltiness value is 108, but not when its saltiness value is below 108. assuming acme foods' sample consumers are representative of people in general, which of the following best represents the just noticeable difference for saltiness? a. 8% b. 108 c. 80% d. 100
Answers: 2
You know the right answer?
Construct profit diagrams or profit tables on expiration to show what position in IBM puts, calls an...
Questions

Mathematics, 03.02.2021 19:30

Mathematics, 03.02.2021 19:30
History, 03.02.2021 19:30
History, 03.02.2021 19:30
Mathematics, 03.02.2021 19:30
Mathematics, 03.02.2021 19:30

Mathematics, 03.02.2021 19:30

Mathematics, 03.02.2021 19:30
Mathematics, 03.02.2021 19:30


