Which is true of the population shown in this graph?
a.
it shows the effect of overpop...

Biology, 18.08.2019 18:30 angeline2004
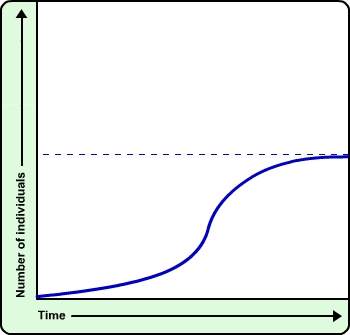
Which is true of the population shown in this graph?
a.
it shows the effect of overpopulation on a species.
b.
the number of individuals will eventually drop to zero.
c.
the population has increased until it reached its carrying capacity.
d.
there are no limiting factors to control population growth.

Answers: 1
Another question on Biology
Biology, 21.06.2019 21:30
Many animals cannot sweat to maintain a stable body temperature. what is one other way animals can cool down?
Answers: 2
Biology, 22.06.2019 21:30
Abotanist working in the amazon rain forest discovers a new species of orchid. interestingly, males but not females of a certain wasp species keep visiting the flowers of these orchids. why?
Answers: 3
Biology, 23.06.2019 00:30
Which is an example of precipitation. 1snow 2clouds 3natural gases 4organic matter
Answers: 1
You know the right answer?
Questions


Chemistry, 10.12.2020 14:00


Spanish, 10.12.2020 14:00
Mathematics, 10.12.2020 14:00

Social Studies, 10.12.2020 14:00

Social Studies, 10.12.2020 14:00

Health, 10.12.2020 14:00
Mathematics, 10.12.2020 14:00
English, 10.12.2020 14:00
English, 10.12.2020 14:00

English, 10.12.2020 14:00


