
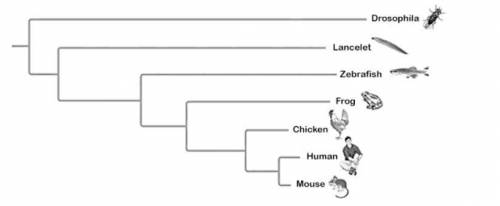
The phylogenetic tree in the figure below was constructed by comparing sequences of homologs of a gene that plays a role in development; drosophila was used as an outgroup. The branch lengths are proportional to the amount of genetic change in each lineage; varying branch lengths indicate that the gene has evolved at different rates in different lineages.
The relative lengths of the zebrafish and chicken branches in the phylogenetic tree indicate that
the homolog evolved more slowly in the zebrafish's lineage
the homolog evolved more rapidly in the zebrafish's lineage
zebrafishes evolved before chickens
chickens evolved before zebrafishes

Answers: 2
Another question on Biology
Biology, 22.06.2019 10:30
What is the best conclusion based on this data? the hypothesis was not supported because the data indicated that fertilizing plants does not improve plant growth. the hypothesis was supported; to get the best growth, use 5 milliliters of fertilizer per plant. the hypothesis was not supported; the data indicated that too much fertilizer can inhibit plant growth. the hypothesis was supported; to get the best growth, use 15 milliliters of fertilizer per plant.
Answers: 1
Biology, 22.06.2019 16:30
How do disease caused by bacteria and disease caused by viruses react to antibiotics?
Answers: 2
You know the right answer?
The phylogenetic tree in the figure below was constructed by comparing sequences of homologs of a ge...
Questions


Biology, 24.07.2019 08:50

English, 24.07.2019 08:50

History, 24.07.2019 08:50

History, 24.07.2019 08:50


