
Biology, 02.03.2021 22:10 cierrajo2020
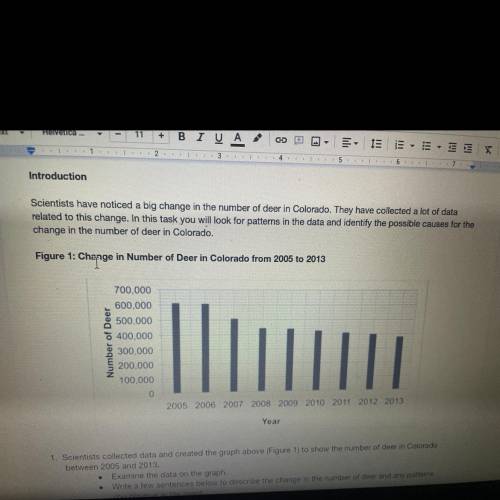
Scientists collected data and created the graph above (Figure 1) to show the number of deer in Colorado
between 2005 and 2013.
Examine the data on the graph.
Write a few sentences below to describe the change in the number of deer and any patterns
you observe in the graph.
Be sure to use data from the graph to support your answer.

Answers: 3
Another question on Biology
Biology, 21.06.2019 15:30
*will mark brainliest to first correct answer* photosynthesis led to increasing levels during the later proterozoic eon? a. oxygen b. water c. carbon dioxide d. none of the above
Answers: 2
Biology, 21.06.2019 19:00
Study the image of this rock.which characteristic best supports its formation from sedimentary processes? it has many layers.it is coarse-grained.its grain shape is round.its texture is non-banded.
Answers: 1
Biology, 21.06.2019 22:30
White-tailed deer are considered to be an overpopulated species in the central united states. which of these events probably contributed the most to white-tailed deer exceeding their carrying capacity?
Answers: 1
You know the right answer?
Scientists collected data and created the graph above (Figure 1) to show the number of deer in Color...
Questions

Mathematics, 16.05.2021 07:10

Chemistry, 16.05.2021 07:10


World Languages, 16.05.2021 07:10

Biology, 16.05.2021 07:10

Biology, 16.05.2021 07:10
Mathematics, 16.05.2021 07:10

French, 16.05.2021 07:10
Biology, 16.05.2021 07:10
Biology, 16.05.2021 07:10


