
Biology, 02.12.2020 21:30 jessiegarrison1
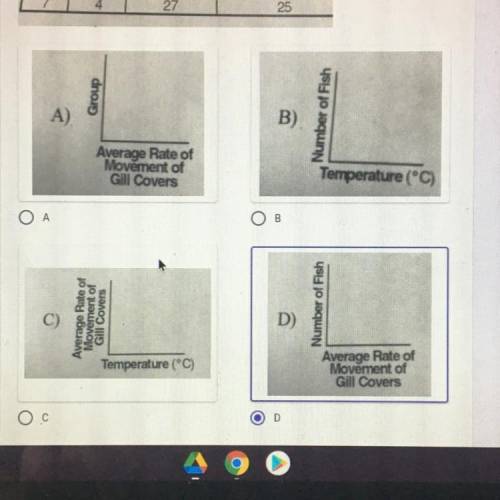
In an investigation, students determined the average rate of movement of
gill covers of a species of freshwater fish at different temperatures. The
results are shown in the data table below. Which labeled axes should be
used to graph the relationship between the two variables? *
DATA TABLE
Average Rate
Number Temperature of Movement of Gill
Groupſ of Fish (°C) Covers per Minute
1 5
10
15
2. 6
15
3 4
18
4 7
20
5
6
23
60
6
4
25
57
7 4
27
25
(81818|க

Answers: 2
Another question on Biology
Biology, 22.06.2019 06:00
During the process of two rails or sides break apart and attract new nucleotide bases to form a new and complete strand.
Answers: 2
Biology, 22.06.2019 06:00
Im inn a ! what"s the answer which of the following is one way creativity can scientists? by ensuring they follow the scientific method by increasing the amount of time it takes to complete scientific experiments by making sure they only try things that have already been proven by leading them to ask more questions about the natural world
Answers: 1
Biology, 22.06.2019 09:10
Which zone within the open-ocean zone is home to the most organisms? deep zone surface zone intertidal zone transition zone
Answers: 1
You know the right answer?
In an investigation, students determined the average rate of movement of
gill covers of a species o...
Questions


Mathematics, 14.07.2019 22:40
English, 14.07.2019 22:40
Mathematics, 14.07.2019 22:40
Biology, 14.07.2019 22:40
English, 14.07.2019 22:40

Social Studies, 14.07.2019 22:40

Chemistry, 14.07.2019 22:40


Mathematics, 14.07.2019 22:40


