
Biology, 09.11.2020 20:30 rebekah2503
Which Biome?
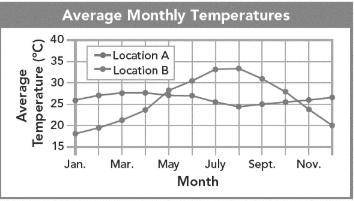
An ecologist collected climate data from two locations. The graph shows the monthly average temperatures in the two locations. In Location A, the total yearly precipitation is 273 cm. In Location B, the total yearly precipitation is 11 cm.
1. Analyze Graphs What specific question is this graph addressing?
2. Analyze Graphs Use the graph as evidence to draw a conclusion about the temperature over the course of the year in Location A and Location B.
3. Apply Scientific Reasoning In which biome would you expect to find each location, given the precipitation and temperature data? Use scientific reasoning to explain your answer.
4. Construct Graphs Look up the average monthly temperature last year for your community. Construct a graph and plot the data. Then, research the monthly rainfall for your city, and plot those data on your graph. Based on your results, which biome do you live in? Did the data predict the biome correctly?

Answers: 3
Another question on Biology
Biology, 22.06.2019 04:10
Select the correct answer. tay-sachs disease is caused by a mutation in the hexa gene located on chromosome 15. tay-sachs follows an autosomal recessive pattern of inheritance. with the of the diagram, identify which of the offspring will be an unaffected carrier. a diagram showing the genes of parents who are carriers of tay-sachs disease a. a, b, and c b. b and c c. a and d d. a e. d
Answers: 3
Biology, 22.06.2019 06:40
The first generation of offspring from the cross of two parents is called the a.f1 generation b.f2 generation c.short generation d.p generation
Answers: 1
Biology, 22.06.2019 10:30
What is the best conclusion based on this data? the hypothesis was not supported because the data indicated that fertilizing plants does not improve plant growth. the hypothesis was supported; to get the best growth, use 5 milliliters of fertilizer per plant. the hypothesis was not supported; the data indicated that too much fertilizer can inhibit plant growth. the hypothesis was supported; to get the best growth, use 15 milliliters of fertilizer per plant.
Answers: 1
You know the right answer?
Which Biome?
An ecologist collected climate data from two locations. The graph shows the monthly av...
Questions

Mathematics, 14.12.2021 23:10
Biology, 14.12.2021 23:10

Social Studies, 14.12.2021 23:10


Biology, 14.12.2021 23:10

Mathematics, 14.12.2021 23:10
Mathematics, 14.12.2021 23:10
Mathematics, 14.12.2021 23:10
Mathematics, 14.12.2021 23:10
English, 14.12.2021 23:10


