PLZ PLZ PLZ help me?!?!? Also the graph with the info is attached.
Question 1
Based on the gra...

Biology, 27.10.2020 14:00 JASMINEM6284
PLZ PLZ PLZ help me?!?!? Also the graph with the info is attached.
Question 1
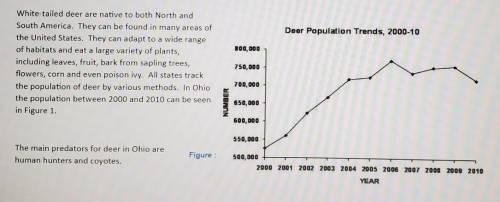
Based on the graph what might have happened to the number of deer predators between 2000 and 2004?
A The number of predators increased
B The number of predators decreased
C The number of predators equalized
D The number of predators quadrupled
Question 2
What is happening to the deer population between 2005 and 2010?
A it increases exponentially and then stabilizes
B it decreases and then stabilizes
C it stays about the same
D it plummets
Question 3
During the same period 2005 2010 what might have also happened to the number of deer hunting licenses?
A Less people wanted to hunt deer so they didn't buy a hunting license
B the graph goes up and then goes down so there are more people hunting deer
C the graph goes down so there are more wolves and ticks
D the graph is different so there is no change

Answers: 3
Another question on Biology
Biology, 21.06.2019 15:30
Organisms within a population must compete for resources to survive
Answers: 2
Biology, 21.06.2019 19:30
The diagram below represents a marine food web and a process that can harm the human population. each circle represents an organism and the smaller dots inside them represent a toxic substance. what is being represented and how does it harm the population? the diagram represents biological half-life, in which toxins build up in organisms higher up on the food chain, and this can negatively impact humans who consume the organisms and the toxic substance. the diagram represents biomagnification, in which toxins build up in organisms higher up on the food chain, and this can negatively impact humans who consume the organisms and the toxic substance. the diagram represents the process by which different organisms prey upon each other; this can impact the human population by reducing the number of organisms that do not contain the toxin. the diagram represents the way that toxins are metabolized by living organisms, with those at greater trophic levels able to metabolize more efficiently than those at lower levels. this means that those at higher tropic levels are safer for humans to consume compared to the organisms at lower trophic levels.
Answers: 1
Biology, 22.06.2019 02:00
Choose one animal (cheetas) and research on the internet what has contributed to this animal becoming "endangered" or "threatened." what animal you have chosen? how long has the animal been endangered or threatened? what has contributed to this animal’s endangered or threatened status? why is it important to save this animal from extinction? after researching and gathering facts, write a 350-word letter from the point of view of an animal rights' activist. be sure to include at least five facts that you learned from your research.
Answers: 3
Biology, 22.06.2019 03:30
Rease is an enzyme used by plants to break down urea (a nitrogen-containing compound) into carbon dioxide and ammonia. urease urea > > > carbon dioxide and ammonia ammonia is broken down by plants into a nitrogen source plants need to grow. thus, plants could not use urea as a nitrogen source unless it was first converted to ammonia. in soybean plants there are two different kinds of urease, one produced in the seeds and the other produced in the leaves of the plant. three types of soybean plants were used in a set of experiments: normal soybeans and two mutant strains, one lacking the urease in the seeds only (strain 1) and one lacking urease in the leaves only (strain 2). experiment 1 separate areas in a field were planted with normal, strain 1, and strain 2 soybeans. all types of soybeans appeared to grow, flower, and produce seeds equally well. there were no externally detectable differences among the strains. experiment 2 small pieces of plant leaves of equal weight were obtained from each type of soybean plant and separately placed on media in culture dishes. tissue growing in this way will become an unorganized clump of cells referred to as callus. to provide a controlled nitrogen source, half the tissue samples of each type were placed on media containing urea, and the other half of the samples were placed on media containing ammonia. after 30 days, the weight gain for each of the callus samples was determined. results are shown in the table below.
Answers: 2
You know the right answer?
Questions

Mathematics, 28.10.2019 18:31

Social Studies, 28.10.2019 18:31
Mathematics, 28.10.2019 18:31

Advanced Placement (AP), 28.10.2019 18:31

Physics, 28.10.2019 18:31

History, 28.10.2019 18:31
History, 28.10.2019 18:31
Biology, 28.10.2019 18:31
Mathematics, 28.10.2019 18:31
Engineering, 28.10.2019 18:31


English, 28.10.2019 18:31
Social Studies, 28.10.2019 18:31


