Sea Ice Minimum (million km
W
03
1980
1985
1990
1995
2005
...

Sea Ice Minimum (million km
W
03
1980
1985
1990
1995
2005
2010
2015
2020
2000
Year
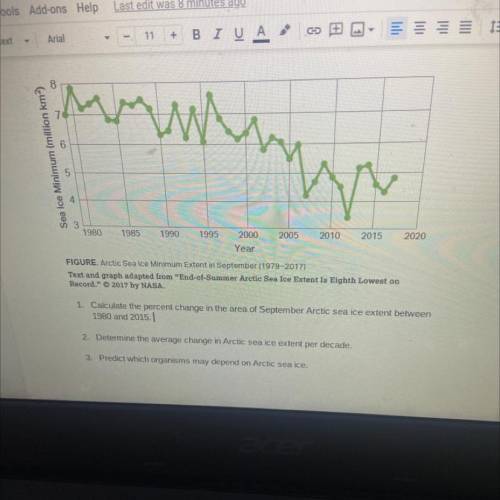
FIGURE. Arctic Sea Ice Minimum Extent in September (1979-2017)
Text and graph adapted from "End-of-Summer Arctic Sea Ice Extent Is Eighth Lowest on
Record." 2017 by NASA.
1. Calculate the percent change in the area of September Arctic sea ice extent between
1980 and 2015.
2. Determine the average change in Arctic sea ice extent per decade.
3. Predict which organisms may depend on Arctic sea ice.

Answers: 2
Another question on Biology
Biology, 21.06.2019 12:30
Two true-breeding pea plants were crossed. one parent is round, terminal, violet, constricted, while the other expresses the respective contrasting phenotypes of wrinkled, axial, white, full. the four pairs of contrasting traits are controlled by four genes, each located on a separate chromosome. in the f1 only round, axial, violet, and full were expressed. in the f2, all possible combinations of these traits were expressed in ratios consistent with mendelian inheritance. (a) what conclusion about the inheritance of the traits can be drawn based on the f1 results? (b) in the f2 results, which phenotype appeared most frequently? what mathematical expression predicts the probability of occurrence of this phenotype? (c) which f2 phenotype is expected to occur least frequently? what mathematical expression predicts this probability? (d) in the f2 generation, how often is either of the p1 phenotypes likely to occur? express your answer as a fraction (example: 3/16).
Answers: 3
Biology, 21.06.2019 16:00
The rate at which molecules water and oxygen can enter a cell is determined by the-
Answers: 3
Biology, 21.06.2019 22:30
Listed in the item bank are some key terms and expressions associated with the categories seen in the venn diagram. to find out more information about items, some have more details available when you click on them. drag and drop each item onto the proper area of the diagram. if an item describes more than one category, be sure to place it in the overlapping space. viruses are tiny infectious pathogens that cause many different diseases, such as polio, and the flu. though they are similar to one celled organisms in some ways, in many ways they are very different. use the venn diagram below to show the similarities and differences between viruses and living organisms.
Answers: 3
Biology, 22.06.2019 01:10
Determine if the following statement is true or false. if true, choose true. if false, choose the rewording that is true. according to the law of independent assortment, alleles for each gene are inherited together so that they always stay together. according to the law of independent assortment, offspring express a combination of their parents' traits. according to the law of independent assortment, alleles for a characteristic split during meiosis and combine during fertilization. true according to the law of independent assortment, alleles for each gene are inherited independently so that no two alleles stay together.
Answers: 1
You know the right answer?
Questions
Biology, 04.01.2020 05:31

Mathematics, 04.01.2020 05:31
Mathematics, 04.01.2020 05:31

Mathematics, 04.01.2020 05:31

History, 04.01.2020 05:31
Mathematics, 04.01.2020 05:31
Mathematics, 04.01.2020 05:31

History, 04.01.2020 05:31
Mathematics, 04.01.2020 05:31


