
Biology, 20.09.2020 19:01 TheGaines4life
Select the correct location on the graph.
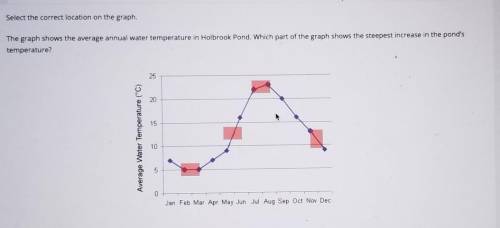
The graph shows the average annual water temperature in Holbrook Pond. Which part of the graph shows the steepest increase in the pond's
temperature?
25
20
15
Average Water Temperature (°C)
10
5
0
Jan Feb Mar Apr May Jun Jul Aug Sep Oct Nov Dec

Answers: 2
Another question on Biology
Biology, 21.06.2019 21:00
In natural selection, what is actually “selected? ” a) alleles are directly selected b) genotypes are directly selected c) phenotypes are directly selected d) entire populations are directly selected
Answers: 2
Biology, 22.06.2019 00:00
How do diseases caused by bacteria and diseases caused by viruses react to antibiotics?
Answers: 1
Biology, 22.06.2019 09:30
What type of appendages do sponges cnidarians roundworms annelids mollusks arthropods echinoderms and vertebrate have? jointed, not jointed, absent
Answers: 2
Biology, 22.06.2019 14:30
The diagram shows the development of the oocyte and the follicle during the menstrual cycle. identify at which stage in the cycle the hormone levels are at their highest and most active.
Answers: 1
You know the right answer?
Select the correct location on the graph.
The graph shows the average annual water temperature in H...
Questions


Mathematics, 30.01.2020 04:42

History, 30.01.2020 04:42

Social Studies, 30.01.2020 04:42

History, 30.01.2020 04:42
Mathematics, 30.01.2020 04:42
Mathematics, 30.01.2020 04:42

Mathematics, 30.01.2020 04:42
Mathematics, 30.01.2020 04:42


