
Biology, 09.04.2020 12:13 dezmondpowell
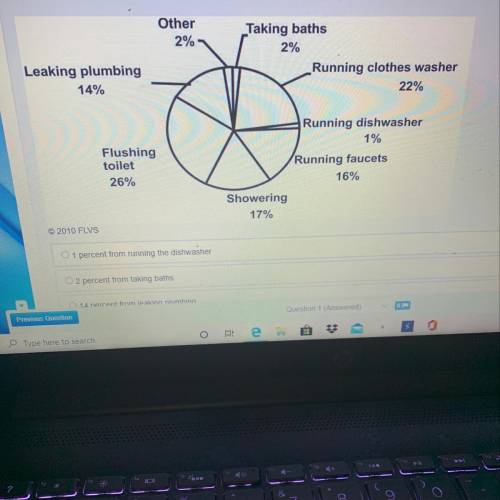
The following graph shows approximately how much water different categories of activities consume each day. According to the graph, how much of a typical home’s daily water use could be prevented through simple repairs?
1 percent from running the dishwasher
2 percent from taking baths
14 percent from leaking plumbing
22 percent from running the clothes washer

Answers: 3
Another question on Biology
Biology, 21.06.2019 20:00
In terms of alternation of generations, the internal parts of the pollen grains of seed-producing plants are most similar to a ) moss sporophyteb) moss gametophyte bearing both male and female gametangiac) fern sporophyted) fern gametophyte bearing only antheridia
Answers: 1
Biology, 22.06.2019 02:30
In the diagram below, the northern hemisphere would be in what season at position a a.fall b. winter c.summer d.spring
Answers: 1
Biology, 22.06.2019 03:30
What does the hardy-weinberg principle relate to? a. chances of survival of an organism b. frequency of alleles in a population c. natural selection in a species d. causes of evolution among organisms
Answers: 1
Biology, 22.06.2019 04:00
What is the difference between how ionic and covalent bonds form
Answers: 1
You know the right answer?
The following graph shows approximately how much water different categories of activities consume ea...
Questions

Mathematics, 19.10.2019 05:30

History, 19.10.2019 05:30
Mathematics, 19.10.2019 05:30
History, 19.10.2019 05:30


Chemistry, 19.10.2019 05:30
English, 19.10.2019 05:30

Computers and Technology, 19.10.2019 05:30
History, 19.10.2019 05:30


