Which of the following best describes the data presented in the image?
1 point
IMPERIAL VALLE...

Advanced Placement (AP), 17.12.2020 01:00 justynejoseph6877
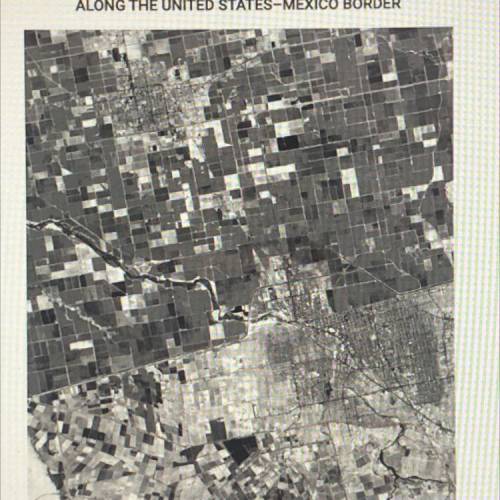
Which of the following best describes the data presented in the image?
1 point
IMPERIAL VALLEY
ALONG THE UNITED STATES-MEXICO BORDER
O Cartogram of quantitative spatial information
O Series of geographic information systems layers
O Political map of a region
O Coordinates for a satellite navigation system
O Remote sensing satellite image of land use

Answers: 1
Another question on Advanced Placement (AP)
Advanced Placement (AP), 27.06.2019 15:40
If i don’t finish my flvs work will i get held back
Answers: 3
Advanced Placement (AP), 27.06.2019 22:30
Disorder characterized by a set of inflexible, maladaptive behavior patterns that keep a person from functioning appropriately in society; lack of personal distress
Answers: 1
Advanced Placement (AP), 29.06.2019 11:10
Correlation tells us that two traits or behaviors are related to one another, but it does not prove a.) that your control group has been randomly selected b.) that one trait or behavior caused the other c.) that your study was replicated d.) that your results can now be generalized
Answers: 3
Advanced Placement (AP), 29.06.2019 12:10
One of the major problems with case studies is that they cannot be a.) proved as a valid measure of human behavior b.) replicated c.) operationalized d.) published in scientific journals
Answers: 1
You know the right answer?
Questions

Mathematics, 27.10.2020 04:20

History, 27.10.2020 04:20

Biology, 27.10.2020 04:20
Mathematics, 27.10.2020 04:20


English, 27.10.2020 04:20
Mathematics, 27.10.2020 04:20
Mathematics, 27.10.2020 04:20
Mathematics, 27.10.2020 04:20
Mathematics, 27.10.2020 04:20

Chemistry, 27.10.2020 04:20
English, 27.10.2020 04:20


Health, 27.10.2020 04:20


