
Advanced Placement (AP), 03.11.2020 19:50 Nicky156
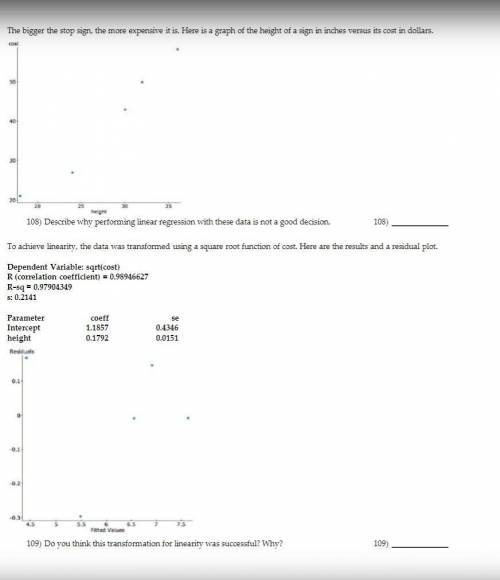
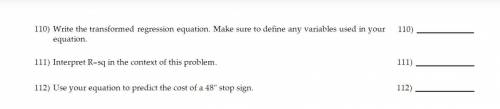
The bigger the stop sign, the more expensive it is. Here is a graph of the height of a sign in inches versus its cost in dollars. 1. Describe why performing linear regression with these data is not a good decision. To achieve linearity, the data was transformed using a square root function of cost. Here are the results and a residual plot. Dependent Variable: sqrt(cost) R (correlation coefficient) = 0.98946627 R-sq = 0.97904349 s: 0.2141 2. Do you think this transformation for linearity was successful? Why? 3. Write the transformed regression equation. Make sure to define any variables used in your equation. 4. Interpret R-sq in the context of this problem. 5. Use your equation to predict the cost of a 48" stop sign. Parameter coeff se Intercept 1.1857 0.4346 height 0.1792 0.0151

Answers: 3
Another question on Advanced Placement (AP)
Advanced Placement (AP), 24.06.2019 21:30
The torque output of an engine is usually measured in the units of a rpm b bhp c foot pounds d feet per pound
Answers: 1
Advanced Placement (AP), 25.06.2019 14:10
Among the following environmental factors, which does not have a long-term impact on the composition of a region's soil? a. kinds of crops grown b. types of fungi present c. topography of the landscape d. variety of species of mammals e. number of freezes occurring annually
Answers: 1
Advanced Placement (AP), 25.06.2019 15:50
This is an ap world history question. i am working on a worksheet which has a vent diagram with each circle labeled either us or byzantine economy. the middle is the similarities. can someone explain to me the similarities and especially the differences between the two?
Answers: 3
Advanced Placement (AP), 26.06.2019 23:30
What can you conclude if data from a study agree with the result predicted by the hypothesis? a. the data must contain systematic errors. b. the data show that the hypothesis could be true. c. the data are unrelated to the hypothesis. d. the data prove that the hypothesis is false.
Answers: 1
You know the right answer?
The bigger the stop sign, the more expensive it is. Here is a graph of the height of a sign in inche...
Questions

Mathematics, 24.02.2021 05:40
Mathematics, 24.02.2021 05:40
Mathematics, 24.02.2021 05:40


History, 24.02.2021 05:40
Mathematics, 24.02.2021 05:40

Biology, 24.02.2021 05:40
Mathematics, 24.02.2021 05:40

Geography, 24.02.2021 05:40
History, 24.02.2021 05:40

Law, 24.02.2021 05:40

English, 24.02.2021 05:40

Physics, 24.02.2021 05:40
Mathematics, 24.02.2021 05:40
History, 24.02.2021 05:40


